

Training
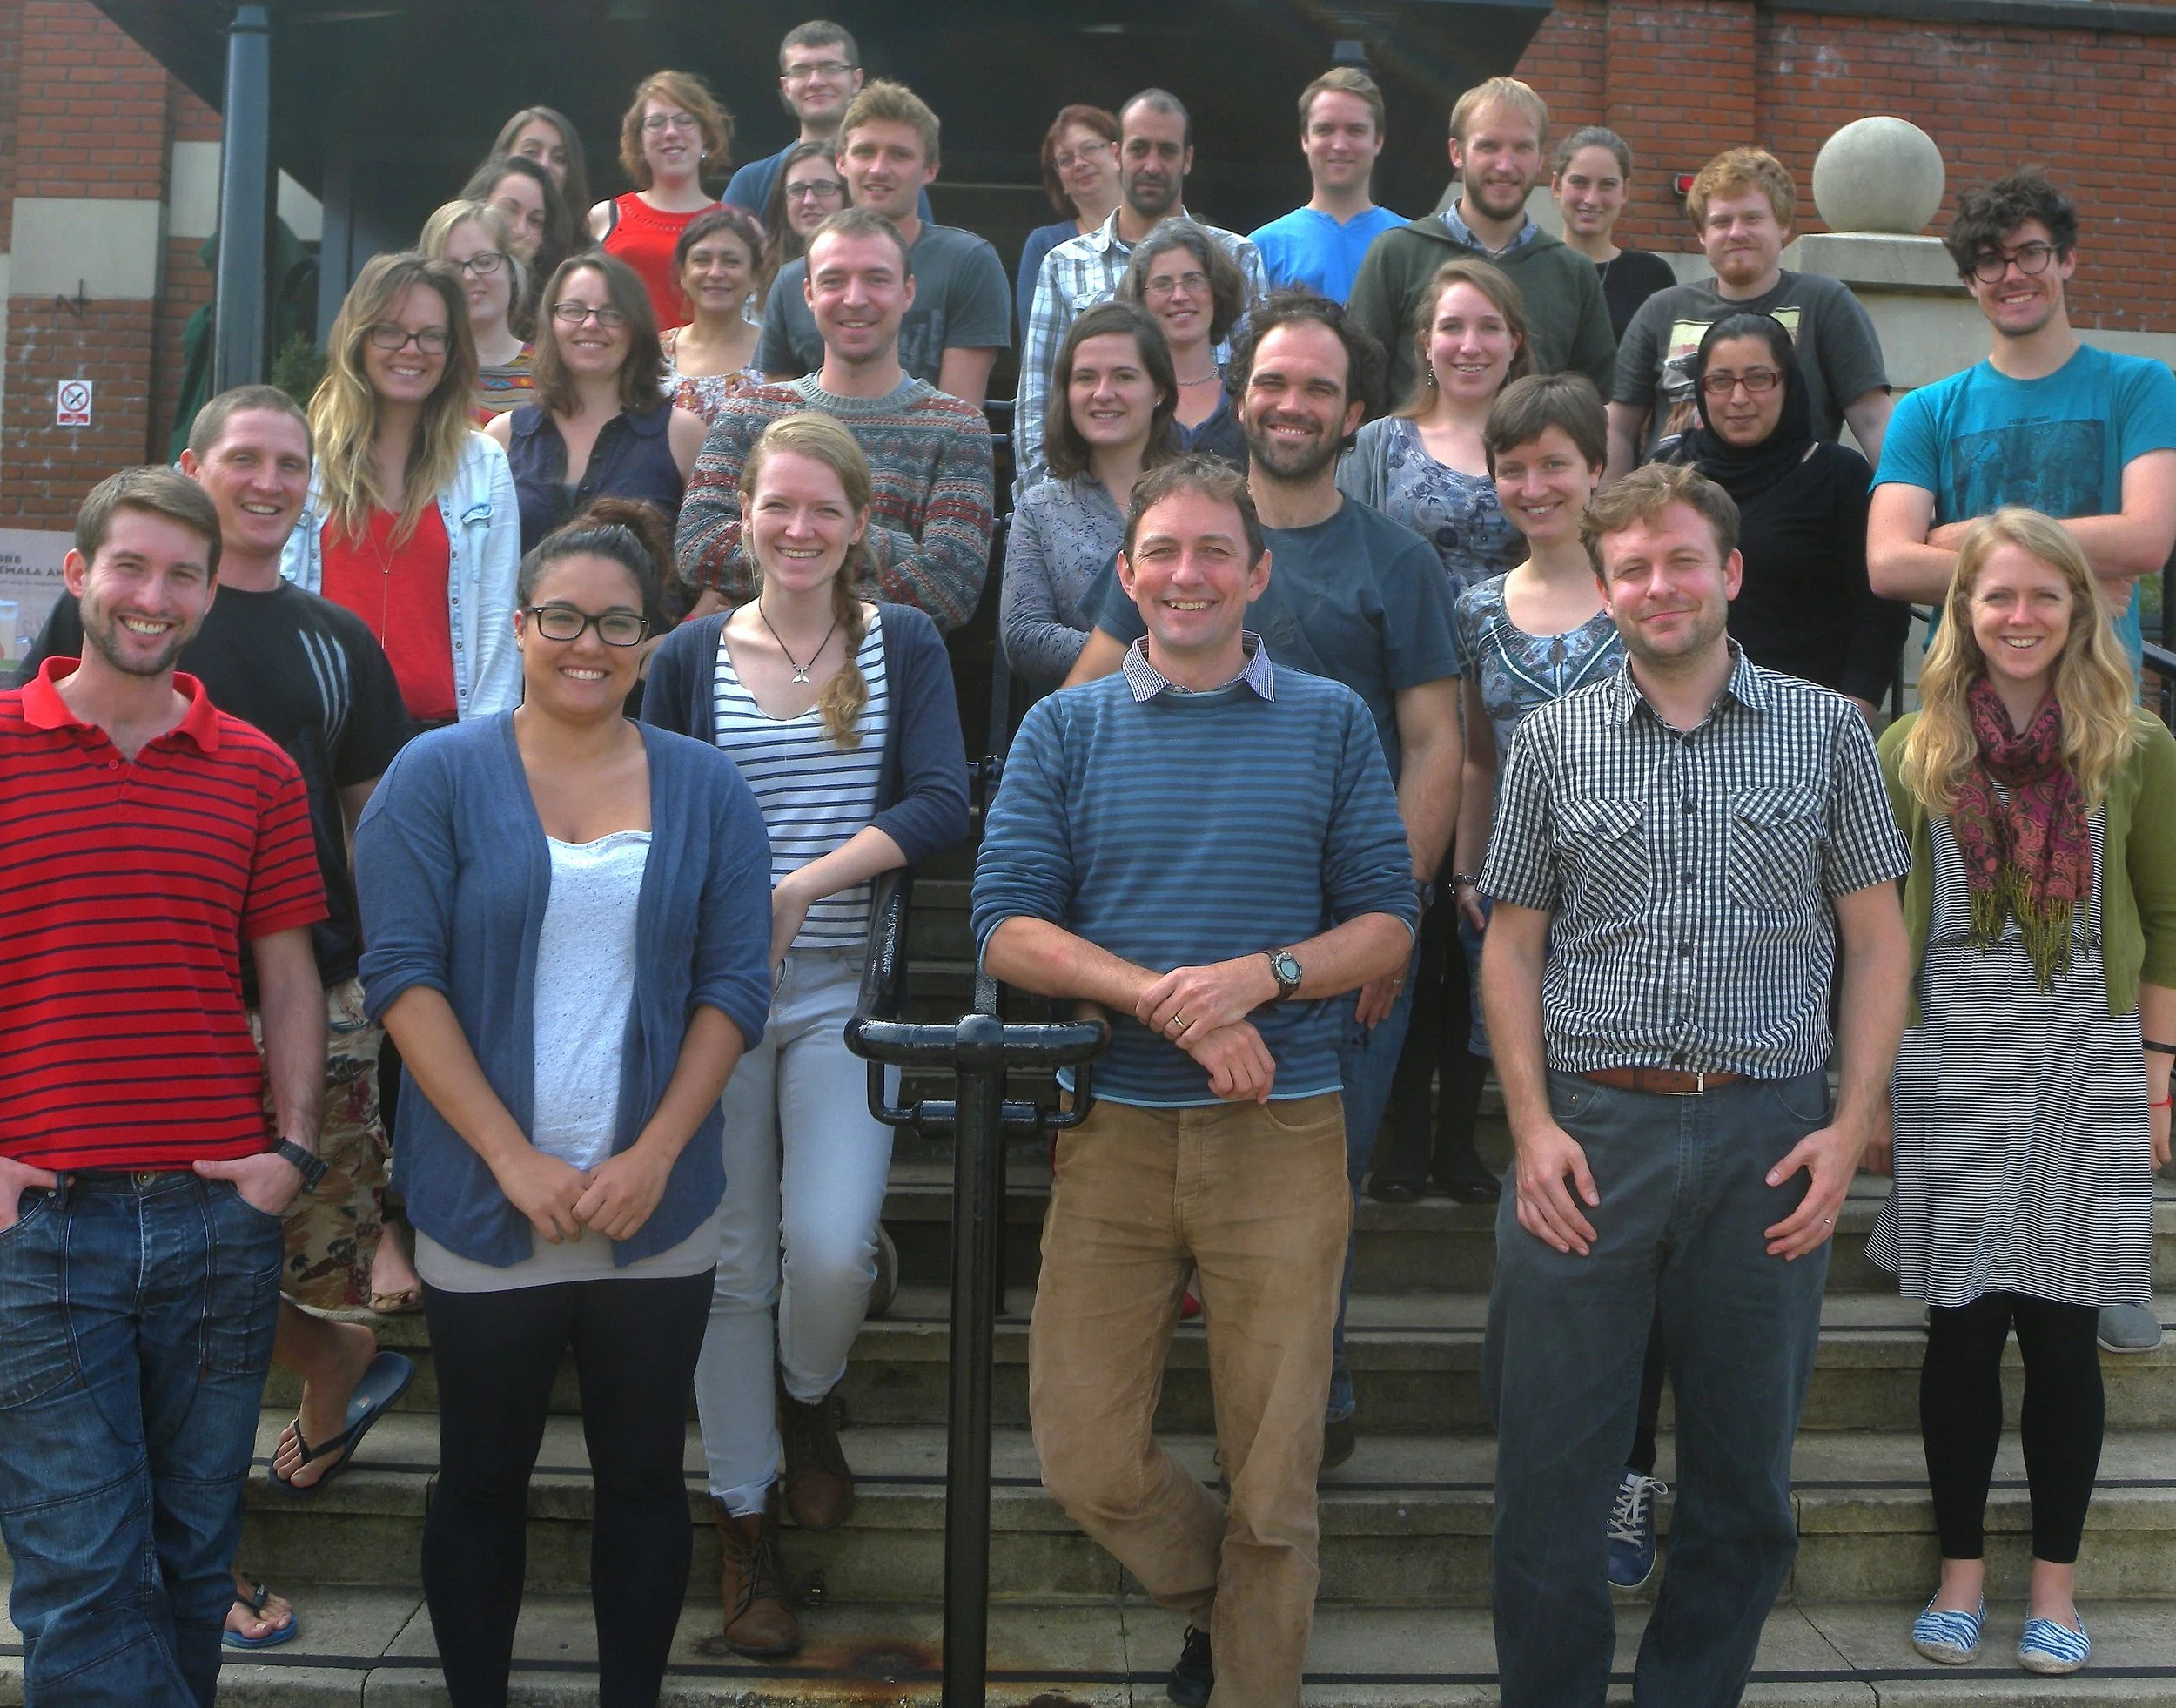
Statistical analysis is an increasingly important and useful part of the toolkit of techniques that are available for understanding the environment. Eco-explore offers a range of standard and bespoke training course formats, designed to help scientists to become familiar with the R statistical software package, and to explore its potential as a powerful tool for analysing their own data, whatever their specific field of research. Learning is supported by a course guidebook, template scripts, and through post-course support and networking.
Our training course programmes are based on weekly half-day (9am-12pm) workshops. Courses are online using Zoom with recordings provided but can be offered in person on request. These courses have been provided to a range of academic and applied institutions including; the RSPB, various Wildlife trusts and Universities including Cardiff, Reading, Aberystwyth, Swansea and DTPs including GW4+ and the Natural Environment Research Council.
Our Courses
Our Courses

Introduction to Data Analysis with R
4 DAY COURSE | Wednesdays 09:00am-12:00pm
Dates available:
9th, 16th, 23rd & 30th September 2026
3rd, 10th, 17th & 24th February 2027
Fee: £220 + VAT (£264)
Taught across four Wednesday mornings.
Ideal for ecologists, environmental consultants, conservation professionals, researchers, students and anyone wishing to develop practical data analysis skills.
Learn how to handle, analyse and visualise data using R, one of the most powerful and widely used tools in scientific research, ecology, environmental consultancy and data science.
This practical, hands-on course is designed for complete beginners and assumes no prior experience with R. Through a combination of live online teaching, guided exercises, supporting resources and independent practice materials, you will develop the skills and confidence to undertake your own data analysis projects.
Each session includes live tutor-led demonstrations and opportunities to ask questions, work through exercises and discuss analytical approaches. Between sessions, participants will have access to additional learning materials, worked examples and exercises to reinforce their understanding at their own pace.
As part of the course, participants receive:
Four live online teaching sessions led by an experienced data analyst
A comprehensive course handbook and reference guide
All R code used during the course
Example datasets for practice
Additional self-paced learning materials and exercises
The opportunity to apply techniques to your own datasets and receive guidance during the course
Topics covered include:
Introduction to R and RStudio
Understanding scripts and reproducible workflows
Installing and managing packages
Importing, organising and cleaning data
Exploring data using summary statistics and visualisation
Creating publication-quality graphs
Introduction to statistical testing
Linear models and interpreting outputs
Generalised Linear Models (GLMs) for measurement and count data
Communicating and presenting analytical results
By the end of the course, you will be able to import, manage, analyse and visualise data in R, understand the principles behind common statistical approaches, and apply these techniques confidently to your own research or professional projects.

Advanced Data Analysis in R
5 DAY COURSE| Wednesdays 09:00am-12:00pm
Dates Available:
14th, 21st, 28th October and 4th & 11th November 2026
7th, 14th, 21st, 28th April and 5th May 2027
Fee: £275 + VAT (£330)
Taught across five Wednesday mornings.
Ready to take your statistical analysis to the next level?
This advanced course is designed for participants who already have experience using R and are familiar with linear models but wish to develop a deeper understanding of modern statistical approaches used in research, environmental science, ecology, healthcare and applied data analysis.
Through a combination of live online teaching, practical exercises, worked examples and self-paced learning materials, you will learn how to analyse more complex datasets and address the challenges commonly encountered in real-world research and professional practice.
Each session combines tutor-led demonstrations with hands-on exercises, allowing participants to build and interpret advanced statistical models using R. Participants are encouraged to bring their own datasets and analytical questions for discussion throughout the course.
As part of the course, participants receive:
Five live online teaching sessions led by an experienced data analyst
A comprehensive course handbook and reference guide
All R code used during the course
Example datasets and worked case studies
Additional self-paced learning materials and exercises between sessions
Opportunities to discuss and apply techniques to your own data
Topics covered include:
Revisiting statistical modelling principles and model selection
Generalised Linear Models (GLMs): choosing appropriate error structures
Generalised Linear Mixed Models (GLMMs) for hierarchical and repeated-measures data
Generalised Additive Models (GAMs) for non-linear relationships
Zero-Inflated Models for count data with excess zeros
Model diagnostics and validation
Interpreting and communicating model outputs
Visualising complex model results
Selecting appropriate modelling approaches for different data types and research questions
By the end of the course, you will be able to build, interpret and critically evaluate a range of advanced statistical models in R, understand their assumptions and limitations, and confidently apply them to your own research or professional projects.
Prerequisites: Participants should be comfortable using R and RStudio and have a basic understanding of linear modelling. Completion of our Introduction to Data Analysis with R course, or equivalent experience, is recommended.
Data Visualisation with R
2 DAY COURSE | Tuesdays 09:00am-12:00pm
Dates Available:
Fee: £110 + VAT (£132)
Learn how to create clear, professional and publication-quality graphics using R.
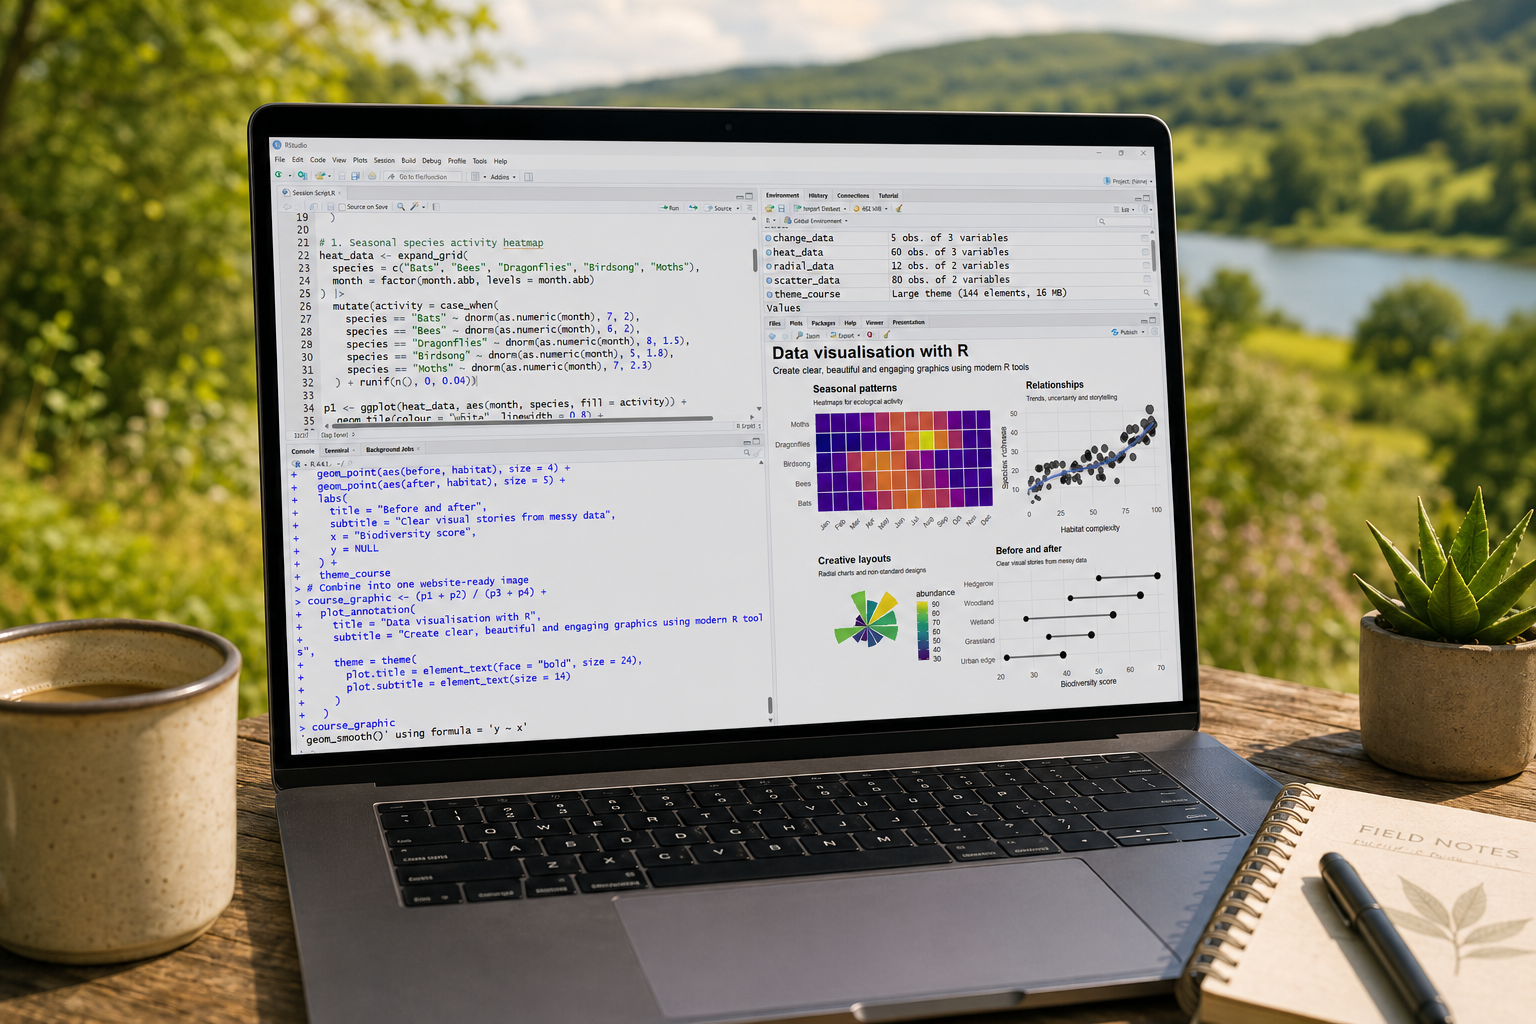
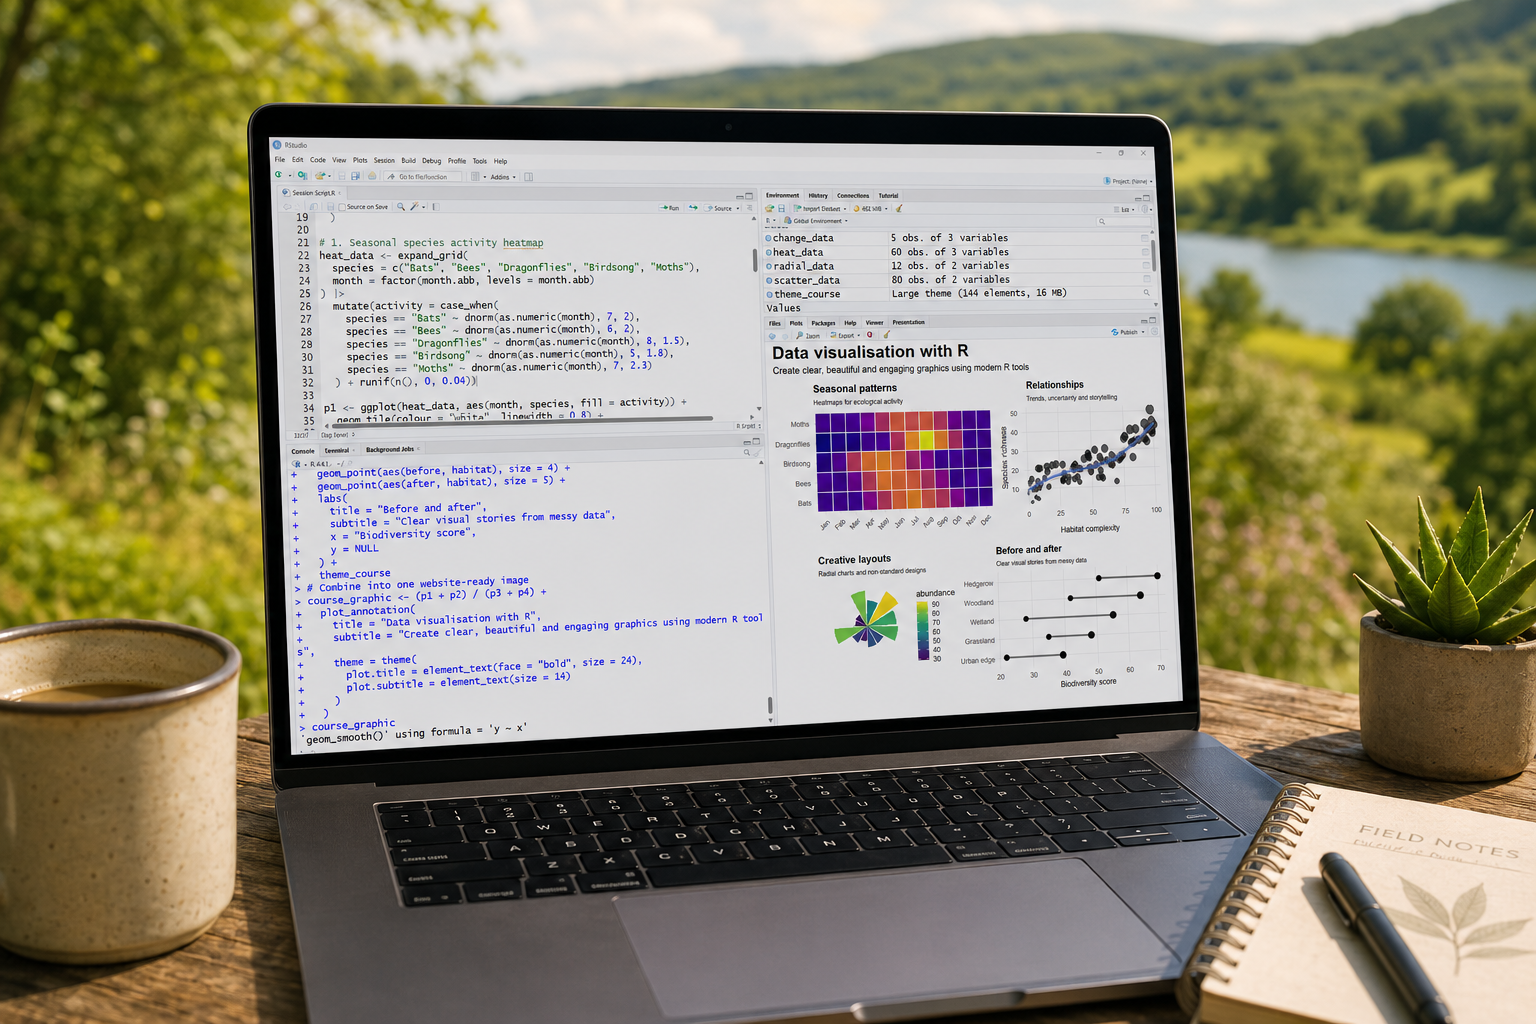
Effective data visualisation is an essential skill for researchers, consultants, analysts and anyone who needs to communicate evidence clearly. This practical course focuses on transforming data into informative and visually appealing figures using the powerful ggplot2 package, alongside a range of complementary visualisation tools within R.
Through live online teaching, guided exercises and worked examples, participants will learn how to design figures that communicate key messages, avoid common pitfalls, and meet the standards expected in scientific publications, consultancy reports and professional presentations.
Taught over two mornings, each session combines tutor-led demonstrations with hands-on exercises, allowing participants to build a portfolio of visualisation techniques that can be applied immediately to their own work.
As part of the course, participants receive:
Two live online teaching sessions
A comprehensive course handbook and reference guide
All R code used during the course
Example datasets and worked examples
Additional self-paced learning materials and exercises
Opportunities to apply techniques to your own datasets
Topics covered include:
Principles of effective data visualisation
Introduction to the Grammar of Graphics (ggplot2)
Creating charts and figures using ggplot2
Customising themes, colours and layouts
Producing publication-quality graphs
Visualising distributions, trends and relationships
Multi-panel figures and faceting
Mapping and spatial visualisation basics
Visualising model outputs and uncertainty
Exporting high-quality graphics for reports, publications and presentations
Common mistakes in data visualisation and how to avoid them
By the end of the course, you will be able to produce clear, professional and visually engaging graphics in R, select appropriate visualisation techniques for different types of data, and communicate analytical results more effectively to a wide range of audiences.
Prerequisites: Participants should have a basic familiarity with R and RStudio. Completion of our Introduction to Data Analysis with R course, or equivalent experience, is recommended.
4 Day Online Course | Wednesdays 9am-12pm
9th, 16th, 23rd & 30th September 2026
Ideal for ecologists, environmental consultants, conservation professionals, researchers, students and anyone wishing to develop practical data analysis skills.
Learn how to handle, analyse and visualise data using R, one of the most powerful and widely used tools in scientific research, ecology, environmental consultancy and data science.
This practical, hands-on course is designed for complete beginners and assumes no prior experience with R. Through a combination of live online teaching, guided exercises, supporting resources and independent practice materials, you will develop the skills and confidence to undertake your own data analysis projects.
Each session includes live tutor-led demonstrations and opportunities to ask questions, work through exercises and discuss analytical approaches. Between sessions, participants will have access to additional learning materials, worked examples and exercises to reinforce their understanding at their own pace.
As part of the course, participants receive:
Four live online teaching sessions led by an experienced data analyst
A comprehensive course handbook and reference guide
All R code used during the course
Example datasets for practice
Additional self-paced learning materials and exercises
The opportunity to apply techniques to your own datasets and receive guidance during the course
Topics covered include:
Introduction to R and RStudio
Understanding scripts and reproducible workflows
Installing and managing packages
Importing, organising and cleaning data
Exploring data using summary statistics and visualisation
Creating publication-quality graphs
Introduction to statistical testing
Linear models and interpreting outputs
Generalised Linear Models (GLMs) for measurement and count data
Communicating and presenting analytical results
By the end of the course, you will be able to import, manage, analyse and visualise data in R, understand the principles behind common statistical approaches, and apply these techniques confidently to your own research or professional projects.
Fee: £220 + VAT (£264)